
The Relevance of Historical and Forecast Periods in a Business Valuation
MediaIf you're interested in exploring how AI tools can automate financial forecasts, normalize historicals, or simulate valuation scenarios for your business, we recommend reading our in-depth guide on AI-powered business valuation platforms. These platforms help streamline and enhance the reliability of your valuation process.
In business valuation, the integrity and credibility of your analysis hinge on two fundamental pillars: the historical period and the forecast period. These periods provide the empirical and theoretical groundwork for understanding a business’s financial health—both past and future.
This guide offers a comprehensive breakdown, real-world numerical examples, and visual infographics to demonstrate the powerful role of historical and forecast data in determining enterprise value (EV) or equity value.
? Infographic: Valuation Timeline Overview
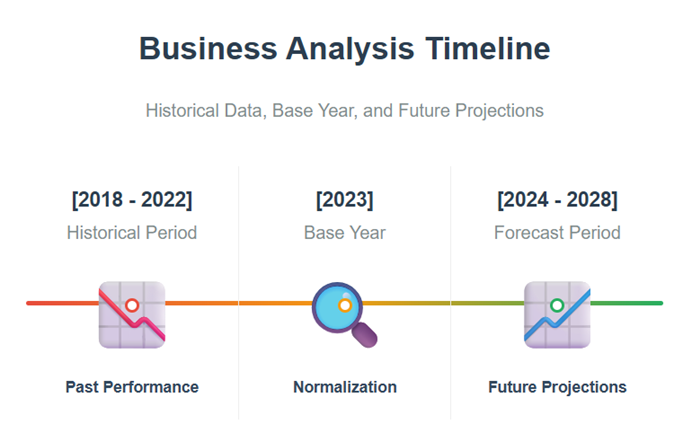
? Historical Period: A Foundation of Facts
The historical period usually spans 3 to 5 years, and its primary function is to showcase how the business has performed operationally and financially.
? Example: Historical Data of XYZ Co. (2018–2022)
|
Year |
Revenue ($M) |
EBITDA Margin |
CapEx ($M) |
Working Capital ($M) |
|
2018 |
8.0 |
12% |
1.2 |
0.9 |
|
2019 |
8.5 |
14% |
1.0 |
1.0 |
|
2020 |
7.8 |
10% |
0.8 |
1.2 |
|
2021 |
9.2 |
15% |
1.4 |
1.1 |
|
2022 |
10.0 |
16% |
1.6 |
1.3 |
Insight: EBITDA margins improved from 12% to 16%, while revenue increased steadily (except for a dip in 2020 due to COVID). This indicates a healthy operational trend worth projecting forward.
? Forecast Period: A Forward-Looking Lens
The forecast period typically spans 3–10 years, depending on industry dynamics and business maturity. The goal is to project future performance to estimate future cash flows.
? Example: Forecast for XYZ Co. (2023–2027)
|
Year |
Revenue ($M) |
EBITDA Margin |
EBITDA ($M) |
CapEx ($M) |
FCFF ($M) |
|
2023 |
11.0 |
17% |
1.87 |
1.8 |
0.9 |
|
2024 |
12.5 |
18% |
2.25 |
2.0 |
1.1 |
|
2025 |
14.0 |
19% |
2.66 |
2.2 |
1.4 |
|
2026 |
15.5 |
20% |
3.10 |
2.5 |
1.6 |
|
2027 |
17.0 |
20% |
3.40 |
2.7 |
1.8 |
? Real DCF Valuation Example Using Historical & Forecast Periods
Let’s apply the data from XYZ Co. to perform a simplified DCF valuation.
Assumptions
- Forecast Period: 2023–2027
- WACC: 10%
- Terminal Growth Rate: 3%
- Final Year FCFF (2027): $1.8M
Step 1: Calculate Present Value of FCFFs
PV of FCFFs = ∑t=15 FCFFt / (1 + WACC)t
= 0.9 / (1.10)1 + 1.1 / (1.10)2 + 1.4 / (1.10)3 + 1.6 / (1.10)4 + 1.8 / (1.10)5
= 0.818 + 0.909 + 1.053 + 1.092 + 1.118
= ~$4.99M
Step 2: Calculate Terminal Value
TV = (FCFF2027 × (1 + g)) / (WACC − g)
= (1.8 × 1.03) / (0.10 − 0.03) = 1.854 / 0.07
= ~$26.49M
PV of TV = 26.49 / (1.10)5 = 26.49 / 1.61051
= ~$16.45M
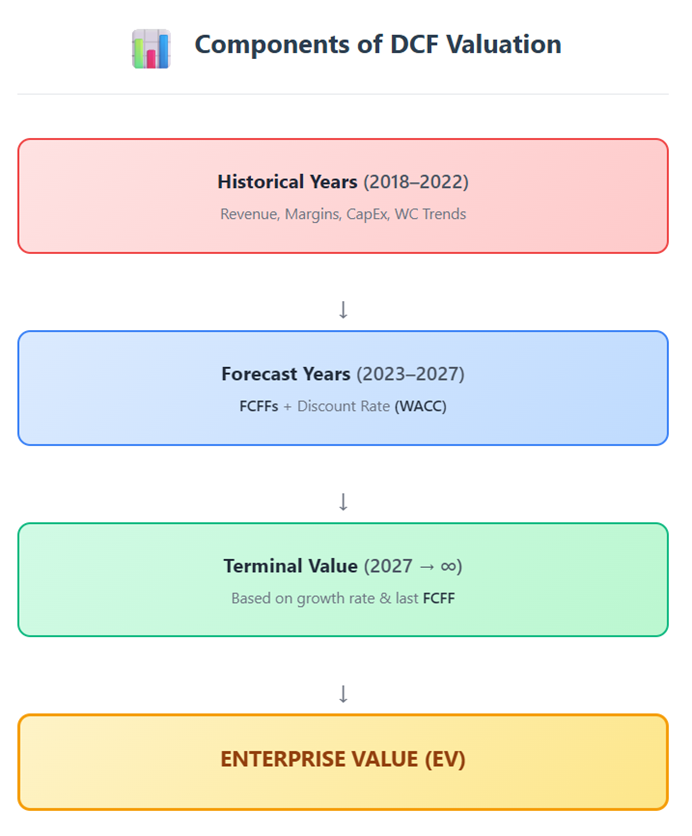
Step 3: Enterprise Value (EV)
EV = PV of FCFFs + PV of Terminal Value
= 4.99 + 16.45 = $21.44M
? Infographic: Components of DCF Valuation
? Choosing the Right Timeframes: Best Practices
Historical Period Guidelines
|
Business Type |
Recommended Years |
|
Startups |
1–2 (if available) |
|
SMEs |
3–5 |
|
Public Companies |
5+ |
Forecast Period Guidelines
|
Business Type |
Forecast Length |
|
Stable Firms |
3–5 years |
|
Growth Startups |
5–10 years |
|
Cyclical Industries |
Full Cycle (~7) |
⚠️ Pitfalls to Avoid in Historical & Forecast Periods
- Cherry-Picking Historical Years: Including only profitable years leads to inflated valuations.
- Unrealistic Forecasts: 50% YoY growth isn’t sustainable unless justified with pipeline data.
- Mismatch Between Growth and CapEx: If you forecast high growth, your CapEx and working capital should increase proportionately.
- Flat Terminal Growth Assumptions: Even modest changes from 2% to 3% drastically affect terminal value.
? Automating Period Analysis With AI Valuation Tools
Tools like Equitest – AI Business Valuation Software simplify this complex process. Here’s how they enhance reliability:
- Import financials directly from accounting software
- Auto-normalize historical data
- Generate scenario-based forecasts
- Run DCF, LBO, and market comps simultaneously
- Sensitivity Analysis Dashboards to test WACC, growth, and exit multiples
? Pro Tip: Integrate Scenario Analysis
Use sensitivity tables to measure the effect of small changes:
|
Growth Rate (%) |
WACC (%) |
Enterprise Value ($M) |
|
2% |
9% |
$24.1M |
|
2% |
10% |
$21.2M |
|
3% |
10% |
$26.5M |
|
3% |
11% |
$22.9M |
Even a 1% change in WACC or terminal growth can swing valuation by millions.
Conclusion: The Dual Power of the Past and the Future
A precise business valuation is anchored in reality and oriented toward the future. Historical data ensures transparency, while forecast periods enable strategic insights. Together, they create a holistic valuation narrative that supports mergers, fundraising, strategic planning, and more.
Mastering the length, logic, and application of both periods is not optional—it’s essential for a defendable and accurate valuation.